

Linux中以二进制方式安装Prometheus
环境准备
prometheus服务器:192.168.13.80
需安装组件
Prometheus 采集、存储数据
alertmanager 接受Prometheus发送的告警信息
Grafana 图表展示
node-exporter 手机操作系统、硬件信息的metrics
安装过程
安装Prometheus
下载地址:官网下载
# 下载
wget https://github.com/prometheus/prometheus/releases/download/v2.53.2/prometheus-2.53.2.linux-amd64.tar.gz
# 解压
tar -xf prometheus-2.53.2.linux-amd64.tar.gz
# 移动到/opt目录下
mkdir /opt/prometheus
mv prometheus-2.53.2.linux-amd64 /opt/prometheus/prometheus

# 创建一个专门用于prometheus的用户
useradd -M -s /usr/sbin/nologin prometheus
# 更改/opt/prometheus的权限
chown prometheus:prometheus -R /opt/prometheus

# 创建systemd服务,开机自启动
vi /usr/lib/systemd/system/prometheus.service
[Unit]
Description=Prometheus Server
Documentation=https://prometheus.io/
After=network.target

[Service]
Type=simple
User=prometheus
Group=prometheus
Restart=on-failure

ExecStart=/opt/prometheus/prometheus/prometheus \
--storage.tsdb.path=/opt/prometheus/prometheus/data \
--storage.tsdb.retention.time=15d \
--config.file=/opt/prometheus/prometheus/prometheus.yml \
--web.enable-lifecycle

ExecReload=/bin/kill -s HUP $MAINPID
ExecStop=/bin/kill -s QUIT $MAINPID


[Install]
WantedBy=multi-user.target

# 因为启动程序会新建/opt/prometheus/prometheus/data目录,会报错,我们手动建下并给权限
mkdir /opt/prometheus/prometheus/data
chown prometheus:prometheus -R /opt/prometheus

# 启动测试
systemctl daemon-reload
systemctl restart prometheus
systemctl status prometheus.service -l

#如有错误自行检查日志
journalctl -u prometheus -f

# 端口监听9090
netstat -lnpt
# 访问http://192.168.13.80:9090测试安装alertmanager
下载地址:官网下载
# 下载
wget https://objects.githubusercontent.com/github-production-release-asset-2e65be/11452538/18333c17-a97b-4a1d-84f7-3562435ca553?X-Amz-Algorithm=AWS4-HMAC-SHA256&X-Amz-Credential=releaseassetproduction%2F20240918%2Fus-east-1%2Fs3%2Faws4_request&X-Amz-Date=20240918T022307Z&X-Amz-Expires=300&X-Amz-Signature=1621c40b658f0485e4a62f190dd76cc07b4341f78f8dfcd65235c71480eff71f&X-Amz-SignedHeaders=host&actor_id=0&key_id=0&repo_id=11452538&response-content-disposition=attachment%3B%20filename%3Dalertmanager-0.27.0.linux-amd64.tar.gz&response-content-type=application%2Foctet-stream

# 解压
tar -xf alertmanager-0.27.0.linux-amd64.tar.gz
# 移动到/opt/prometheus目录下
mv alertmanager-0.27.0.linux-amd64 /opt/prometheus/alertmanager

# 更改/opt/prometheus/alertmanager的权限
chown prometheus:prometheus -R /opt/prometheus

# 创建systemd服务,开机自启动
vi /usr/lib/systemd/system/alertmanager.service
[Unit]
Description=Prometheus AlertManager
Wants=network-online.target
After=network-online.target

[Service]
Type=simple
User=prometheus
Group=prometheus


ExecStart=/opt/prometheus/alertmanager/alertmanager \
--storage.path=/opt/prometheus/alertmanager/data \
--config.file=/opt/prometheus/alertmanager/alertmanager.yml \

Restart=always


[Install]
WantedBy=multi-user.target

# 因为启动程序会新建/opt/prometheus/prometheus/data目录,会报错,我们手动建下并给权限
mkdir /opt/prometheus/alertmanager/data
chown prometheus:prometheus -R /opt/prometheus

# 启动测试
systemctl daemon-reload
systemctl enable alertmanager --now
systemctl status alertmanager -l

#如有错误自行检查日志
journalctl -u alertmanager -f

# 端口监听9093
netstat -lnpt修改prometheus配置支持alertmanager
加入alertmanager
vim /opt/prometheus/prometheus/prometheus.yml

alerting:
   alertmanagers:
     - static_configs:
         - targets:
           # 根据实际填写alertmanager的地址
           - localhost:9093

rule_files:
	# 根据实际填写alertmanager的文件名
	- "alert.yml"
增加触发器配置文件
groups:
- name: Prometheus alert
  rules:
  # 对任何实例超过30s无法联系的情况发出警报
  - alert: 服务告警
    expr: up == 0
    for: 30s
    labels:
        serverity: critical
    annotations:
        instance: "{{ $labels.instance }}"
        description: "{{ $labels.jobs }} 服务已关闭"
检查配置
cd /opt/prometheus/prometheus/
./promtool check config prometheus.yml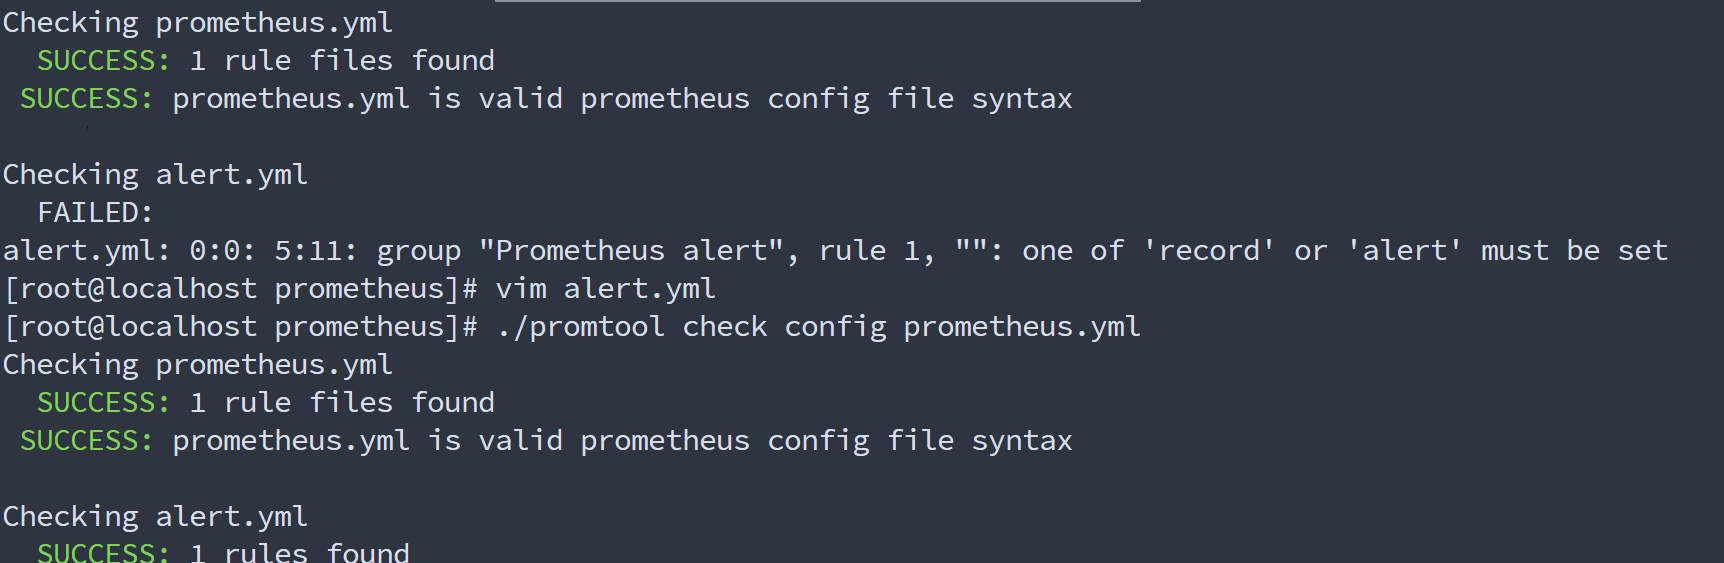
重启Prometheus或者重新加载配置
重启Prometheus
systemctl restart prometheus重载配置 curl -X POST http://localhost:9090/-/reload (需要 --web.enable-lifecycle 配置)
安装Grafana
下载地址:官网下载
# 下载、解压、移动到/opt/prometheus目录
wget https://dl.grafana.com/enterprise/release/grafana-enterprise-11.2.0.linux-amd64.tar.gz
tar -zxvf grafana-enterprise-11.2.0.linux-amd64.tar.gz

# 更改/opt/prometheus/alertmanager的权限
chown prometheus:prometheus -R /opt/prometheus

# 创建systemd服务,开机自启动
vim /etc/systemd/system/grafana.service

[Unit]
Description=Grafana server
Documentation=http://docs.grafana.org
[Service]
Type=simple
User=prometheus
Group=prometheus
Restart=on-failure

ExecStart=/opt/prometheus/grafana/bin/grafana-server \
        --config=/opt/prometheus/grafana/conf/defaults.ini \
        --homepath=/opt/prometheus/grafana
[Install]
WantedBy=multi-user.target

chown prometheus:prometheus -R /opt/prometheus

# 启动测试
systemctl daemon-reload
systemctl enable grafana --now
systemctl status grafana -l

#如有错误自行检查日志
journalctl -u grafana -f

# 端口监听3000
netstat -lnpt第一次登录会让输入新密码,密码已改为 landui@123
安装node-exporter
下载地址:官网下载
# 下载
wget https://objects.githubusercontent.com/github-production-release-asset-2e65be/9524057/a7e04f41-5543-40e2-9060-26fefe32bb4b?X-Amz-Algorithm=AWS4-HMAC-SHA256&X-Amz-Credential=releaseassetproduction%2F20240918%2Fus-east-1%2Fs3%2Faws4_request&X-Amz-Date=20240918T033247Z&X-Amz-Expires=300&X-Amz-Signature=00acdf0927397f4d03a82b2746743e77b8aa5f7d7764022d35223aa04759ab8d&X-Amz-SignedHeaders=host&actor_id=0&key_id=0&repo_id=9524057&response-content-disposition=attachment%3B%20filename%3Dnode_exporter-1.8.2.linux-amd64.tar.gz&response-content-type=application%2Foctet-stream
# 解压
tar -xf node_exporter-1.8.2.linux-amd64.tar.gz
# 移动到/opt/prometheus目录下
mv node_exporter-1.8.2.linux-amd64 /opt/prometheus/node_exporter

# 更改/opt/prometheus/alertmanager的权限
chown prometheus:prometheus -R /opt/prometheus

# 创建systemd服务,开机自启动
vi /usr/lib/systemd/system/node_exporter.service
[Unit]
Description=node_exporter
After=network.target

[Service]
User=prometheus
Group=prometheus


ExecStart=/opt/prometheus/node_exporter/node_exporter

Restart=on-failure


[Install]
WantedBy=multi-user.target

# 给权限
chown prometheus:prometheus -R /opt/prometheus

# 启动测试
systemctl daemon-reload
systemctl enable node_exporter --now
systemctl status node_exporter -l

#如有错误自行检查日志
journalctl -u node_exporter -f

# 端口监听9100
netstat -lnpt修改prometheus配置监控本机(注意文件格式)
cat >> /opt/prometheus/prometheus/prometheus.yml << "EOF"

# 在scrape_configs这行下面添加如下配置
	# node-exporter配置
	- job_name : 'node-exporter'
	  scrape_interval: 15s
	  static_configs:
	  - targets: ['localhost:9100']
	    labels:
	    instance: Prometheus服务器
EOF

# 检查配置
cd /opt/prometheus/prometheus/
./promtool check config prometheus.yml
# 重载配置
curl -X POST http://localhost:9090/-/reload